
Solar Spring, get sunlight the first time the "uv index" touches 3

I tried to have ai make a website to explain this, but it just wouldn’t work so Im just rambling in a blog post.
You are vitamin d deficient, especially in the winter. It make hormones and maintains your immune system, You make vitamin d when uv light hits your skin and you store about a month worth. There are approximately 3 months where you do not get enough uv light. 3 > 1; you run out, the flu season starts and if you rolled the genetic rolls badly, seasonal depression.
Now the strength of this sunlight will follow a stack of sin waves, and we take a filter of such as “>3” you can get a behavior of a square wave that starts and stops
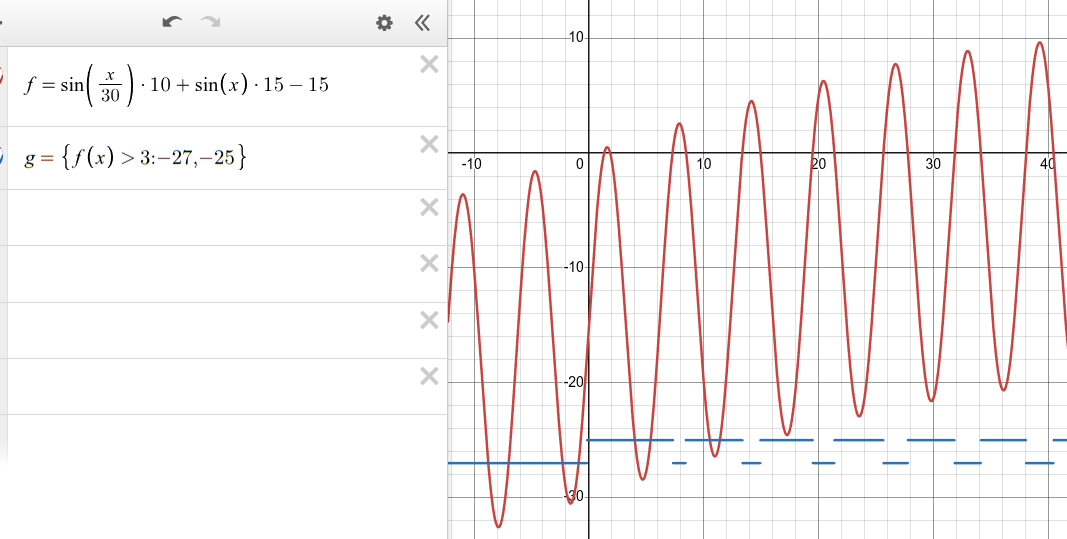
(the graph of 365 days and hourly sun strength isn’t very visible)
There will be a first day of the year when you can get vitamin d, this will be exactly at solar noon and you can easily find out when this is by googling “uv index $mycity”. I wanted to make a map so the information on your solar noon (it can by off of official noon by an hour+daylight saving bullshit, if your aiming for the first 15 minutes that matters)
You could imagine explaining this to children by saying “blue light goes loopy in the atmosphere, red light goes thru; and uv light is invisible and is ‘more blue’ then blue light” and some happy sun’s saying shit about the immune system; blah blah blah. Combined with this map and maybe you could tweet it at rfk to make it official policy. I think “the sun” is bipartisan, the commies didnt try to nuke it for being better then the other planets (yet).
I estimate theres a month of malnourishment on the table, you go outside at exactly the right time and you get out of the starvation mode of a vitamin. Compare it to scurvy. Tell the mask cultists getting children 15 minutes of recess is as important as “2 weeks” of mask wearing.
—-
ai failures:
``` SPEC.md
goal: creating a webpage that communicates “go outside for 15 minutes, on solar spring at solar noon”
the primary difficulty will be the map:
1. it should be a simple canvas
2. it should use https://commons.wikimedia.org/wiki/File:Blank_US_Map_(states_only).svg
3. https://github.com/plotly/datasets/blob/master/us-cities-top-1k.csv
4. there should be a tooltip that locks to the nearest city that displays the solar infomation
under the map, there should be 3 sections:
1. that explains that uv 3 and complete sunlight is completely unaviable
2. explain a “vitamin D” battery by comparity it to the more visable vitamin C and survy, scores range from -3 to 30, getting enough get you “1 day” of vitamin d, at 0 you body enters stravation modes and in the case of survy the body desides hair and teeth airnt worth the resources. -1, -2; likewise vitamin d and having an immune system and feeling like going outside.
3. combine the 2 concepts suggesting that the “first dose” of sunlight a month eariler will get you out of a stravation mode.
```
the map the ai would produce:
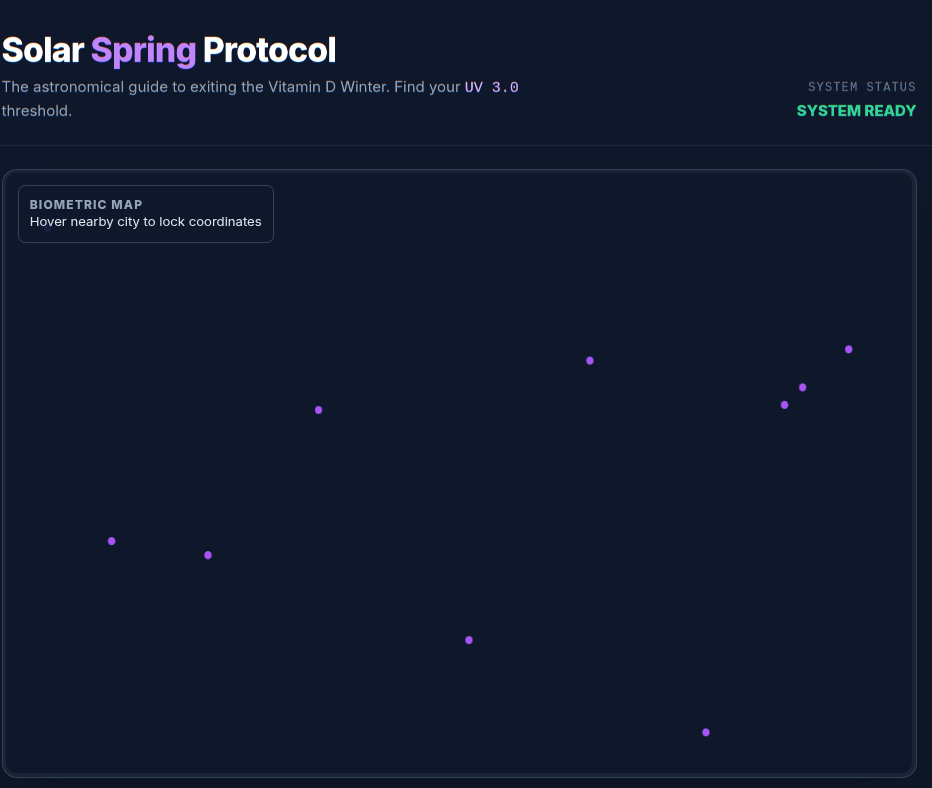
I tried like 6 different runs, this failure was shocking to me, the map is apparently quite hard and Im not interested in learning enough webshit to do it myself. It couldnt quite figure out how to get a collection of points on top of a map, that had a tool tip with correct information. It could write the functions for finding solar spring, but not get them on an overlay, and im so confused why.